
 Information
Top 40 Export Destinations For Chinese Electric Cars
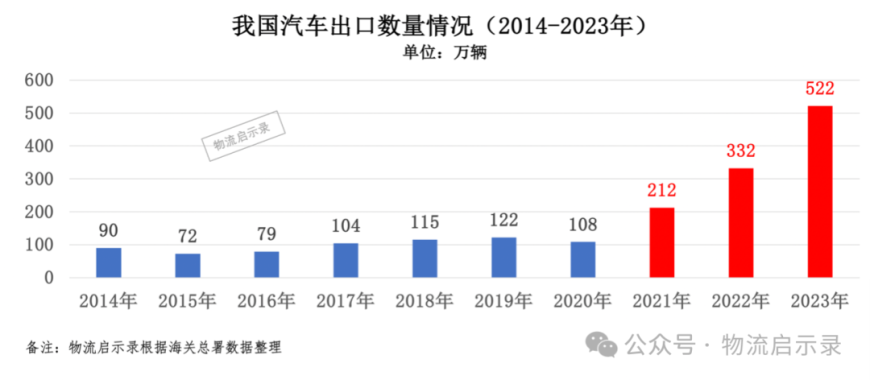
In 2023, China exported 5.221 million vehicles (a year-on-year increase of 57.4%), surpassing Japan for the first time, and becoming the world’s largest exporter of automobiles.

From 2014 to 2023, China’s automobile exports surged from 900,000 vehicles to 5.22 million vehicles, marking a 5.8-fold increase. Particularly noteworthy is the period from 2021 to 2023, during which exports crossed three significant milestones of 2 million, 3 million, and 5 million vehicles.
Here, electric cars have made significant contributions.
In 2023, China exported 1.773 million electric passenger cars (a 67.1% year-on-year increase), accounting for 34% of the total annual exports of automobiles. This means that for every 3 cars exported by China, 1 was an electric passenger car.
Of the 1.773 million electric passenger cars, 1.546 million were pure electric vehicles (EVs). This article analyzes the distribution, quantity, and unit price of these 1.546 million pure EVs by country.
Overall, in 2023, China exported pure EVs to 175 countries and regions, with a total export quantity of 1.546 million units (a 64.1% year-on-year increase), an export value of 240.314 billion RMB (a 76.4% year-on-year increase), and an average unit price of approximately 155,500 RMB per vehicle.
From a regional perspective
Europe
Europe is the largest consumer market for China’s pure electric vehicles (EVs). In 2023, China exported 640,000 EVs to Europe, accounting for 41.27% of the total. The export value amounted to 132.5 billion RMB, representing 55.13% of the total export value, with an average unit price of approximately 207,600 RMB per vehicle. The main importing countries include Belgium, the United Kingdom, Spain, the Netherlands, Germany, Slovenia, France, and Sweden, contributing 37.28% to the total export quantity.
Southeast Asia
Next is Southeast Asia (11 countries), where China exported 310,000 EVs in 2023, accounting for 20.09% of the total. However, the export value was relatively low at 22.3 billion RMB, representing 9.28% of the total export value, with an average unit price of approximately 71,800 RMB per vehicle. The main importing countries are Thailand and the Philippines, contributing 17.55% to the total export quantity.
Central Asia-Middle East
The Central Asia-Middle East market is noteworthy, with China exporting 194,000 EVs to the region in 2023, accounting for 12.57% of the total. The export value was 29.6 billion RMB, representing 12.31% of the total export value, with an average unit price of approximately 152,300 RMB per vehicle. The main importing countries include Israel, the United Arab Emirates, Turkey, Jordan, Uzbekistan, Kyrgyzstan, and Kazakhstan, contributing 11.99% to the total export quantity.
South Asian
The South Asian market is also significant, with China exporting 116,000 EVs to the region, accounting for 7.53% of the total. However, the export value was relatively low at less than 1.7 billion RMB, representing only 0.70% of the total export value, with an average unit price of approximately 14,500 RMB per vehicle. The main importing countries are India and Bangladesh, contributing 7.02% to the total export quantity.
Latin American
The Latin American market has better quality compared to the South Asian market. China exported 72,000 EVs to the region, accounting for 4.65% of the total. The export value was 9.7 billion RMB, representing 4.04% of the total export value, with an average unit price of approximately 135,100 RMB per vehicle. The main importing countries are Brazil and Mexico, contributing 3.17% to the total export quantity.
Other countries
Additionally, there are Australia-New Zealand, Japan-South Korea, and the United States-Canada markets, where China exported 100,000, 52,000, and 33,000 EVs, respectively. They accounted for 6.48%, 3.38%, and 2.12% of the total, with average unit prices of approximately 188,900 RMB, 263,600 RMB, and 186,000 RMB per vehicle, respectively.
Regarding Hong Kong, Macau, and Taiwan, mainland China exported 21,000 EVs to these regions, accounting for 1.37% of the total. The export value amounted to 4.5 billion RMB, representing 1.88% of the total export value, with an average unit price of approximately 213,400 RMB per vehicle.

From a country perspective
Top 3
Belgium is the largest export destination for China’s pure electric vehicles (EVs). In 2023, China exported 175,400 EVs to Belgium, accounting for 11.35% of the total. The export value amounted to 355.5 billion RMB, representing 14.79% of the total export value, with an average unit price of approximately 202,600 RMB per vehicle.
Next is Thailand, with China exporting 155,900 EVs to Thailand in 2023, accounting for 10.09% of the total. The export value was 17.4 billion RMB, representing 7.24% of the total export value, with an average unit price of approximately 111,600 RMB per vehicle.
The third is the United Kingdom, with China exporting 125,000 EVs to the UK, accounting for 8.11% of the total. The export value amounted to 305 billion RMB, representing 12.7% of the total export value, with an average unit price of approximately 243,600 RMB per vehicle.
From 4 to 10
Following are the Philippines with 115,400 vehicles, Spain with 92,400 vehicles, Australia with 86,400 vehicles, India with 58,600 vehicles, the Netherlands with 55,000 vehicles, Israel with 50,500 vehicles, and Bangladesh with 50,000 vehicles.
The top ten countries accounted for 62.43% of the total export quantity and 58.31% of the total export value.
Top 40 countries
The ranking and unit price details of China’s export destinations for pure electric passenger cars are listed in the following table:
| Ranking (by quantity) | Region | Quantity (unit) | Quantity proportion |
| 1 | Belgium | 175437 | 11.35% |
| 2 | Thailand | 155910 | 10.09% |
| 3 | Britain | 125314 | 8.11% |
| 4 | Philippines | 115423 | 7.47% |
| 5 | Spain | 92395 | 5.98% |
| 6 | Australia | 86437 | 5.59% |
| 7 | India | 58577 | 3.79% |
| 8 | Netherlands | 55002 | 3.56% |
| 9 | Israel | 50541 | 3.27% |
| 10 | Bangladesh | 49957 | 3.23% |
| 11 | Germany | 41156 | 2.66% |
| 12 | Canada | 39904 | 2.58% |
| 13 | Brazil | 36921 | 2.39% |
| 14 | slovenia | 34801 | 2.25% |
| 15 | United Arab Emirates | 34610 | 2.24% |
| 16 | France | 33481 | 2.17% |
| 17 | Türkiye | 32614 | 2.11% |
| 18 | Uzbekistan | 28410 | 1.84% |
| 19 | South Korea | 20824 | 1.35% |
| 20 | Jordan | 20678 | 1.34% |
| 21 | China Hong Kong | 20481 | 1.32% |
| 22 | Sweden | 18685 | 1.21% |
| 23 | New Zealand | 13688 | 0.89% |
| 24 | Indonesia | 13159 | 0.85% |
| 25 | USA | 12363 | 0.80% |
| 26 | Mexico | 12006 | 0.78% |
| 27 | Japan | 11968 | 0.77% |
| 28 | Malaysia | 11645 | 0.75% |
| 29 | Italy | 11377 | 0.74% |
| 30 | Norway | 10508 | 0.68% |
| 31 | Kyrgyzstan | 10457 | 0.68% |
| 32 | Poland | 8915 | 0.58% |
| 33 | Russia | 8503 | 0.55% |
| 34 | Kazakhstan | 8063 | 0.52% |
| 35 | Nepal | 7438 | 0.48% |
| 36 | Costa Rica | 5840 | 0.38% |
| 37 | Belarus | 5166 | 0.33% |
| 38 | Singapore | 4385 | 0.28% |
| 39 | Vietnam | 3780 | 0.24% |
| 40 | Colombia | 3717 | 0.24% |